5 Brand Health Metrics Marketing Leaders Must Track to Predict Revenue
Brand health metrics are the measurable signals of how consumers perceive and move through your funnel, from unaided awareness to advocacy. If you’re starting from zero, track five things: unaided awareness, consideration, Net Promoter Score, purchase intent, and a composite brand equity score. Everything else is refinement. This guide explains how to measure each one, how often, and how to turn the numbers into decisions.
TL;DR:
- Tracking consideration and predictive metrics like purchase intent and preference helps identify sales shifts up to three quarters in advance.
- Continuous or monthly tracking is essential for fast-moving categories and campaigns, while quarterly waves suit slow-purchase categories with stable sales cycles.
- A core set of eight to twelve consistent metrics, combined with prioritized rotating questions, enables effective decision-making and prevents dashboard fatigue.
- Behavioral data such as branded search volume and social listening complement survey insights, especially when adjusting for discrepancies between perceived and actual interest.
- Clear pre-defined actions tied to metric changes prevent analysis paralysis and ensure that data drives accountable strategic decisions.
Table of Contents
- What Brand Health Metrics Actually Measure
- Why Tracking Brand Health Matters to the Business, Not Just Marketing
- The Core Brand Health Metrics Worth Tracking
- How to Measure Brand Health: Surveys, Behavior, and Everything Between
- Building a Brand Tracker That Executives Actually Use
- How Often to Measure and What Counts as Real Movement
- Quincy Samycia on Turning Brand Metrics Into Strategy
- Ready to Turn Metrics Into a Growth Plan?
- An Editorial Take on Measurement-First Brand Strategy
- Sources
- FAQ
What Brand Health Metrics Actually Measure
Brand health, in operational terms, is the combination of how well people know you, how much they prefer you over alternatives, and whether they’d vouch for you to someone else. That’s perception, preference, and advocacy in one package. None of it is abstract. Each dimension has a specific metric attached, and each metric maps to a stage in the customer funnel.
The funnel looks like this in sequence: awareness (unaided and aided), familiarity, consideration, preference, trial or first purchase, ongoing usage, and finally loyalty or advocacy. Each stage has its own diagnostic question:
- Awareness: Do people know you exist without being prompted?
- Familiarity: Do they know what you actually do or sell?
- Consideration: Would they put you on a shortlist?
- Preference: Would they pick you over a named competitor?
- Trial/usage: Have they actually bought or used the product?
- Loyalty/advocacy: Would they buy again, or recommend you?
Here’s the part most marketing teams underweight: these metrics aren’t lagging indicators, they’re leading ones. Shifts in brand health metrics tend to show up in revenue one to three quarters later, which means a consideration dip in Q1 is often a sales problem you’ll feel by Q3. Track the funnel, and you’re reading next quarter’s forecast today.
Why Tracking Brand Health Matters to the Business, Not Just Marketing
A tracker isn’t a marketing vanity project. It’s a warning system. When consideration drops among a key segment before a competitor’s launch even hits headlines, that’s a signal you can act on while there’s still time to respond. When you can’t tell whether a campaign moved perception or just spent budget, a tracker settles the argument with data instead of opinion.
Business leaders use brand health data in three concrete ways:
- Reallocating spend: shifting budget away from channels that aren’t moving awareness or consideration.
- Defending market position: catching a competitor’s share-of-voice surge before it erodes your preference numbers.
- Validating repositioning: confirming a rebrand or messaging shift actually changed how people describe you, not just how you describe yourself.
Trackers work best when they’re tied to decision rules: a defined action, like increasing share of voice, triggered automatically when consideration drops by a set number of points among a target demo. Without that link, even good data sits in a dashboard nobody opens.
Annual studies still have a place. Continuous tracking, though, is what catches a slide before it becomes a quarterly surprise. Annual waves work for slow-moving categories with infrequent purchase cycles. Continuous or quarterly tracking earns its cost anywhere the competitive set moves fast or a launch is imminent.
The Core Brand Health Metrics Worth Tracking
Not every metric deserves equal attention every wave. Some belong in your permanent core set. Others are situational, useful for a specific campaign question and then retired. Here’s the prioritized list, organized by what each one measures, how to capture it, and where it sits in your tracking tier.
Tier 1: always track these.
- Unaided awareness: Ask “What brands come to mind when you think of [category]?” with no prompting. This is the purest measure of mental availability. It’s slow to move and expensive to shift, so treat sudden changes as real signals worth investigating.
- Aided awareness: Show a list of brand names and ask which the respondent recognizes. Useful for tracking how a rebrand or new entrant affects recognition, separate from top-of-mind recall.
- Consideration: “Would you consider buying from [brand] the next time you need [category]?” This is your best single predictor of near-term purchase behavior, and it’s the metric most likely to leak before revenue does.
- Preference: A head-to-head “Which would you choose, brand A or brand B?” question. Preference tells you whether you’re winning the comparison that happens in a shopper’s head before they ever reach a cart.
- Purchase intent: A direct “How likely are you to buy in the next [timeframe]?” scale. Pair it with consideration to separate people who like you from people who’ll actually act.
- NPS/CSAT: Net Promoter Score (“How likely are you to recommend us?”) and Customer Satisfaction Score both measure post-purchase sentiment, but NPS captures advocacy potential while CSAT captures immediate experience quality.
- Brand equity/index: A composite score blending awareness, preference, and loyalty into one number you can trend over time. There’s no single industry formula for this; most teams build a weighted index from the metrics they already track rather than adopting someone else’s blend.
Tier 2: rotate these based on strategic questions.
- Top-of-mind/first mention: The very first brand named in an unaided awareness question, a sharper cut of mental availability than raw awareness.
- Share of voice: Your visibility relative to competitors across paid, earned, and owned media. Useful when you suspect a competitor is outspending you into consideration.
- Sentiment: Positive versus negative tone in social and review mentions, a directional read on brand perception between formal waves.
- Brand uplift/ad-lift: The measured lift in awareness or consideration attributable to a specific campaign, typically run as an exposed-versus-control study.
- Branded organic search/traffic: Search volume and direct traffic tied to your brand name, a free behavioral proxy for interest that doesn’t require a survey at all.
Pro Tip: If awareness is high but consideration is flat, don’t add more top-of-funnel spend. The problem usually sits in positioning or perceived differentiation, not visibility. More impressions on a message people already know and don’t prefer just wastes budget.
A funnel leak like that, high awareness paired with weak consideration, is one of the more common patterns brand trackers surface. It tells you the awareness campaign worked. It also tells you the reason people aren’t considering you isn’t that they haven’t heard of you. It’s that what they’ve heard hasn’t convinced them.
How to Measure Brand Health: Surveys, Behavior, and Everything Between
Survey-based brand trackers remain the backbone of most measurement programs. A fixed-wave survey asks the same core questions to a representative sample at regular intervals, which is what makes trend lines comparable over time. The discipline here matters more than the tool: change your question wording between waves and you’ve broken your own trend line.
Continuous and AI-moderated trackers are the newer alternative, and they solve a real problem: waiting a full quarter to learn that consideration dropped in January is a slow way to run a brand. AI-moderated platforms can surface not just that a metric moved, but why, at a lower cost per wave than a traditional syndicated study. That speed matters most when you’re managing a fast-moving competitive category or just launched a campaign you need to validate quickly.
Social listening and share-of-voice tracking cover the earned-media side surveys miss entirely. They tell you what people are saying about you unprompted, which is a different signal than what they say when a researcher asks.
Web analytics and branded search volume round out the picture as behavioral proxies. Digital behavior across search, social, and e-commerce updates far more frequently than a quarterly survey wave, often on a weekly or even daily basis, and it catches shifts in real purchase-adjacent behavior that stated preference sometimes misses. A tool built for this kind of monitoring, like the options catalogued in this guide to brand monitoring tools, can help you keep tabs on the digital-behavior side without building a custom pipeline.
When survey data and behavioral data disagree, trust the behavioral data for direction and the survey data for magnitude. If branded search is climbing but stated consideration is flat, people are curious but not yet convinced, a different problem than if both are falling together.
- Survey trackers: best for comparable trend lines and diagnosing “why.”
- Social listening: best for real-time sentiment and earned-media reach.
- Web/behavioral analytics: best for near-real-time, low-cost directional signals.
- AI-moderated continuous trackers: best when speed and driver analysis matter more than survey-length depth.
Building a Brand Tracker That Executives Actually Use
The biggest mistake in tracker design isn’t picking the wrong metrics, it’s picking too many. A workable tracker keeps 8 to 12 metrics constant across every wave and rotates 3 to 5 additional metrics to answer whatever strategic question matters that quarter. Past roughly 20 total metrics, survey length balloons, respondent fatigue sets in, and the data gets noisier, not richer.
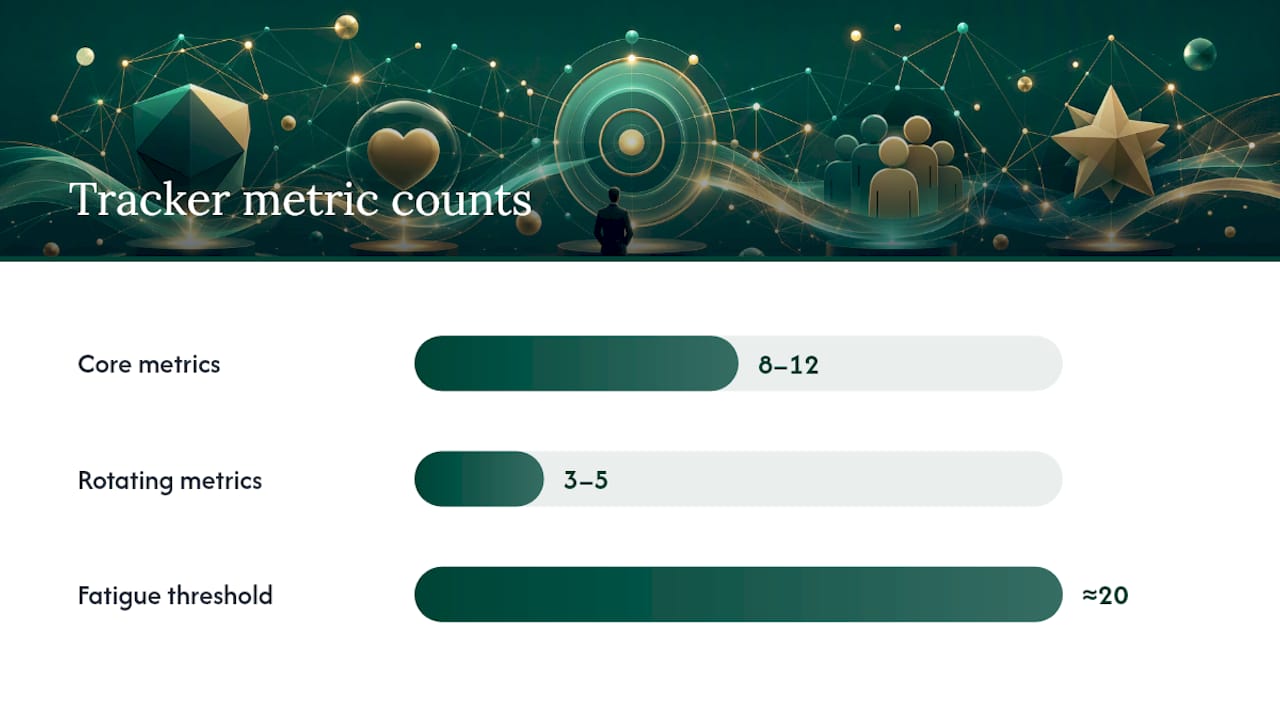
Your core set should be the Tier 1 list: awareness, consideration, preference, purchase intent, NPS, and your equity index. Rotating metrics answer specific questions, like measuring ad-lift right after a campaign launch, then retiring that question once you have your answer.
Benchmarking works on two axes. Internally, compare this quarter to last quarter and to the same quarter a year ago, since brand metrics carry seasonal patterns just like sales do. Externally, track the gap between your numbers and a defined competitive set, not the absolute score in isolation. A consideration score of 34% means very little until you know your closest competitor sits at 51%.
Your executive dashboard needs four things to be useful:
- One composite brand score leadership can track at a glance.
- Funnel conversion rates between each stage, so a leak is visible immediately.
- Trend alerts flagging any metric that moves outside its normal range.
- A recommended action tied to each alert, decided in advance, not improvised in the meeting where the number shows up.
| Dashboard element | What it answers | Update cadence |
|---|---|---|
| Composite brand score | Are we healthier or weaker overall? | Each wave |
| Funnel conversion rates | Where is the biggest leak? | Each wave |
| Competitive gap metrics | Are we gaining or losing ground? | Quarterly |
| Trend alerts + action rules | What do we do about it? | Continuous |
How Often to Measure and What Counts as Real Movement
Cadence depends on category speed. Quarterly waves suit slow-purchase-cycle categories like appliances or B2B software with long sales cycles. Monthly waves fit categories with faster competitive shifts, like consumer packaged goods or retail. Continuous tracking, the model syndicated services like YouGov BrandIndex run, makes sense when you need to catch campaign and news-driven shifts as they happen rather than a quarter after the fact.
Sample size determines what you can actually trust. Roughly 400 respondents per wave lets you reliably detect a 5 to 7 point shift at 95% confidence; smaller moves or segment-level analysis need a larger sample to avoid chasing noise.
| Cadence | Best for | Minimum sample for reliable reads |
|---|---|---|
| Quarterly | Long purchase cycles, stable categories | ~400 per wave |
| Monthly | Fast-moving competitive categories | ~400 per wave, per segment if segmenting |
| Continuous | Campaign tracking, volatile categories | Rolling sample, larger cumulative base |
Treat a single-wave swing as a hypothesis, not a fact. Require two consecutive waves moving in the same direction before you call it a trend and act on it.
Quincy Samycia on Turning Brand Metrics Into Strategy
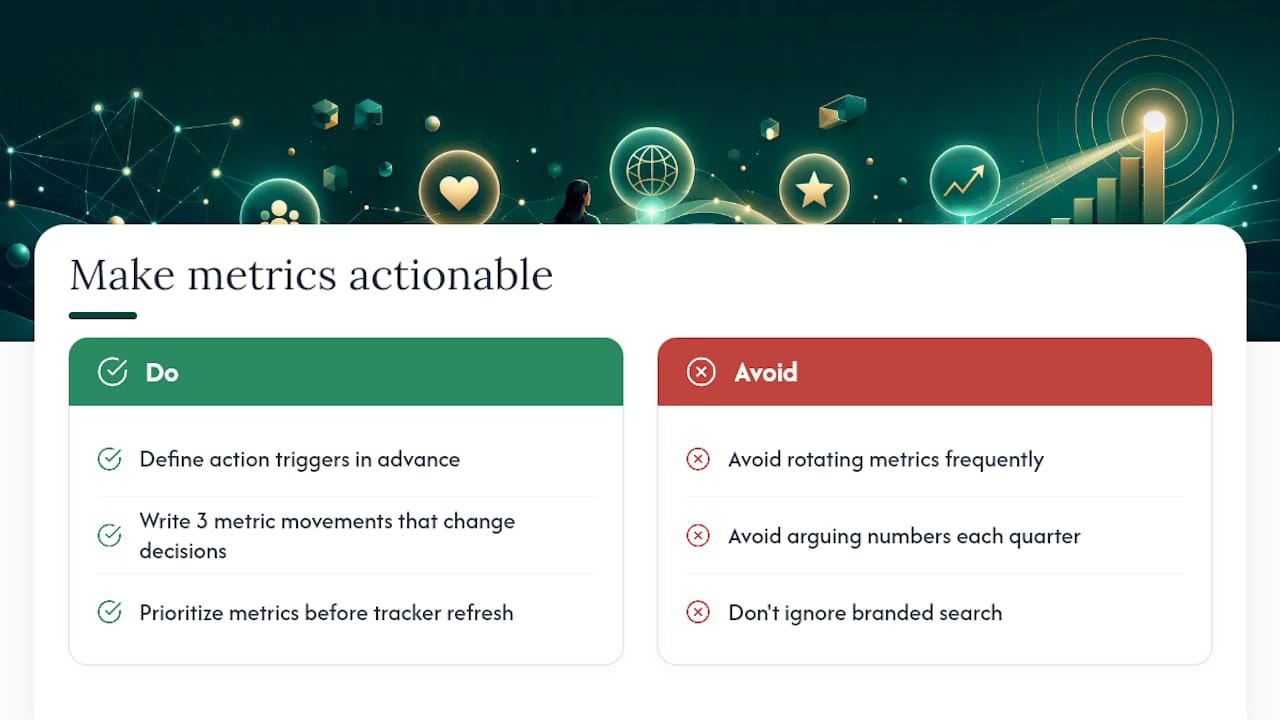
Most brand trackers fail for a boring reason: nobody agreed in advance what a moving number should trigger. Teams collect the data, admire the dashboard, and then argue about what it means every single quarter as if starting from scratch. My Golden Spiral™ framework exists because prioritization has to happen before the wave closes, not after.
The real value of a brand-backed performance model isn’t the metrics themselves. It’s the discipline of deciding, ahead of time, which metric movements are worth a meeting and which aren’t.
The pitfall I see most often isn’t measurement, it’s governance. Too many rotating metrics dilute focus. Stakeholders disagree on what a dip in consideration should mean for their function. And behavioral proxies like branded search get ignored because they don’t fit neatly into a slide template.
Pro Tip: Before your next tracker refresh, write down the three metric movements that would actually change a decision. If you can’t name them, you’re tracking data, not running a brand.
Ready to Turn Metrics Into a Growth Plan?
Most companies don’t have a measurement problem. They have a prioritization problem: too many numbers, no agreed action tied to any of them, and a dashboard nobody trusts enough to act on. If you want help building a tracker that leadership actually uses, and a framework for turning metric movement into a real decision, explore Quincy Samycia’s brand strategy frameworks or bring Quincy in to align your team directly.
An Editorial Take on Measurement-First Brand Strategy
The conventional advice on brand tracking treats it as a research exercise: run the wave, build the deck, present the trends. That’s backwards. The tracker only earns its budget when it’s built to answer a decision someone in the room actually needs to make.
Where most guides fall short is stopping at “measure these ten things.” Measurement without a pre-agreed action is just an expensive way to confirm what you already suspected. The metrics that predict revenue, consideration especially, deserve more scrutiny than a quarterly glance, because they’re telling you something about next quarter’s pipeline, not this quarter’s applause.
If you’re starting from nothing, don’t build the twelve-metric dashboard first. Build the five-metric one, agree on what a five-point move means for budget and messaging, and prove the discipline works before you scale the complexity. The tracker’s job isn’t to look thorough. It’s to make the next decision obvious.
— Quincy
Sources
- Brand health tracking: what to measure and how | GWI
- Brand health tracking — Similarweb
- What is brand health? | HubSpot Blog
- Brand health tracking | User Intuition
FAQ
What Are Product Health Metrics?
Product health metrics track usage, retention, and satisfaction for a specific product line, while brand health metrics measure perception and preference across the entire brand. The two often move together, since a struggling product drags down consideration and NPS for the brand overall.
What Is the Formula for a Brand Health Score?
There’s no universal formula; most organizations build a weighted composite from awareness, consideration, preference, and NPS scores. The common approach blends these components rather than relying on any single metric, since no one number captures the full funnel.
How Do You Measure B2B Brand Health?
B2B brand health uses the same funnel logic as consumer brands, unaided awareness, consideration, preference, and advocacy, but surveys typically target buying-committee roles rather than general consumers, and sample sizes run smaller given narrower target populations. Branded search volume and account engagement data serve as useful behavioral proxies alongside survey waves.
What Are Brand Metrics?
Brand metrics are the individual measurements, awareness, consideration, preference, purchase intent, NPS, and equity, that together describe how a brand is perceived and where it sits in the customer funnel. Tracking them consistently across waves is what turns isolated numbers into a usable trend.