
11 Metrics Brand Teams Use to Measure Brand Performance
Measuring brand performance means tracking how your brand shows up in people’s minds (perception) and in the market (behavior), then connecting those shifts to revenue. The right approach blends survey data with behavioral signals, ties every metric to a business outcome, and follows a set cadence. Start with four headline metrics: awareness, preference, Net Promoter Score, and share of voice. Everything else builds from there.
TL;DR:
- If unaided awareness drops by two points or more, auditing media spend and share of voice should precede creative adjustments.
- Tracking brand preference monthly alongside NPS and purchase intent provides timely signals for revenue shifts.
- Connecting increases in brand preference to immediate growth in win rate within one or two quarters confirms campaign effectiveness.
- Using standardized measures like share of voice and media impact value ensures meaningful external benchmarking against relevant competitors.
- Limiting metrics to five with assigned owners and clear action thresholds helps prevent tracking sprawl and ensures timely response.
Table of Contents
- What Brand Performance Actually Means
- Core Brand Metrics: What to Track and How Often
- Tying Brand Metrics to Revenue, CAC, and Retention
- Building a Measurement Program That Actually Runs
- Benchmarking, Standardization, and Where Comparisons Go Wrong
- Choosing the Right Metrics for Your Company’s Stage
- Applying Brand-Backed Performance to Measurement
- Where Brand Measurement Programs Actually Break
- Measurement-Aligned Brand Strategy From Quincy Samycia
- Sources
- FAQ
What Brand Performance Actually Means
Brand performance is not one number. It’s a composite of three distinct categories, and most measurement programs fail because they mix them up or track only one.
Performance metrics are the hard business numbers your brand influences but doesn’t fully control: market share, revenue growth, customer acquisition cost. Perception metrics live in people’s heads: awareness, associations, favorability, preference. You can only get these through surveys or interviews, because you’re measuring what someone thinks, not what they did. Behavioral metrics capture what people actually do: search for your brand name, visit your site, buy again, refer a friend.
The categories matter because they answer different questions and demand different cadences:
- Performance metrics tell you if the brand is working commercially, but they lag. A market share drop this quarter often reflects perception damage from two quarters ago.
- Perception metrics are diagnostic. If preference falls before revenue does, you have an early warning system.
- Behavioral metrics validate perception data. If survey respondents say awareness rose but branded search volume stayed flat, something’s off with the survey.
Most brand teams over-index on perception surveys because they’re easy to commission, then wonder why the board doesn’t care. The fix is treating all three as one connected system, where perception shifts predict behavior shifts, which eventually show up in performance numbers. A measurement-aligned brand strategy treats these as inputs to one model, not three separate reports nobody reads together.
Core Brand Metrics: What to Track and How Often
Here’s the working list. For each one, you need a measurement method, a cadence, and a defined action when the number moves.
-
Unaided brand awareness. Ask “What brands come to mind when you think of [category]?” with no prompting. This is the hardest awareness to earn and the most predictive of market strength. Measure via survey regularly, using a consistent open-ended prompt so results are comparable over time. Action: if unaided awareness drops two points or more, audit recent media spend and share of voice before touching creative.
-
Aided brand awareness. Show a list of brand names and ask which ones respondents recognize. Easier to move than unaided awareness, useful for tracking campaign lift. Measure regularly alongside unaided awareness.
-
Brand associations. Use Likert scale statements (“This brand is innovative,” “This brand is trustworthy”) rated 1 to 5. Track regularly; these shift slowly and don’t need frequent measurement.
-
Perception and favorability. A direct favorability question, on the same 1 to 5 or 1 to 10 scale every time. Pulse frequently for high-impact categories where sentiment can change rapidly.
-
Brand preference. “If you were buying [category] today, which brand would you choose first?” against named competitors. This is one of the strongest leading indicators you have, and it belongs in your monthly measurement cycle alongside purchase intent.
-
Net Promoter Score. The core question is fixed: “How likely are you to recommend [brand] to a friend or colleague, on a scale of 0 to 10?” Track regularly according to your data volume availability. Action: a three-point NPS drop triggers a churn and support-ticket review, not just a marketing meeting.
-
Loyalty and repeat usage. Pull this from transaction data, not surveys: repeat purchase rate, subscription renewal rate, visit frequency. Behavioral, continuous, and one of the cleanest ties to revenue you’ll find.
-
Market share. Sourced from category sales data or syndicated market reports where available. Review periodically; it moves slowly and responds to competitor actions as well as your own.
-
Share of voice. The percentage of category conversation, media coverage, or ad spend that belongs to your brand versus competitors. Pull regularly from media monitoring tools and social listening platforms.
-
Placements and mentions. Count of press coverage, influencer mentions, and organic references. Useful as a leading indicator for share of voice, but weak on its own, since standardized measures like Media Impact Value account for placement quality and audience reach in ways a raw mention count cannot.
-
Branded search volume. Pull from Google Trends or Search Console regularly. This is the single best behavioral proxy for awareness, and it’s free.
Pro Tip: When aided awareness and branded search volume disagree, trust the search data. Survey respondents overstate recognition to sound informed; search behavior doesn’t lie the same way.
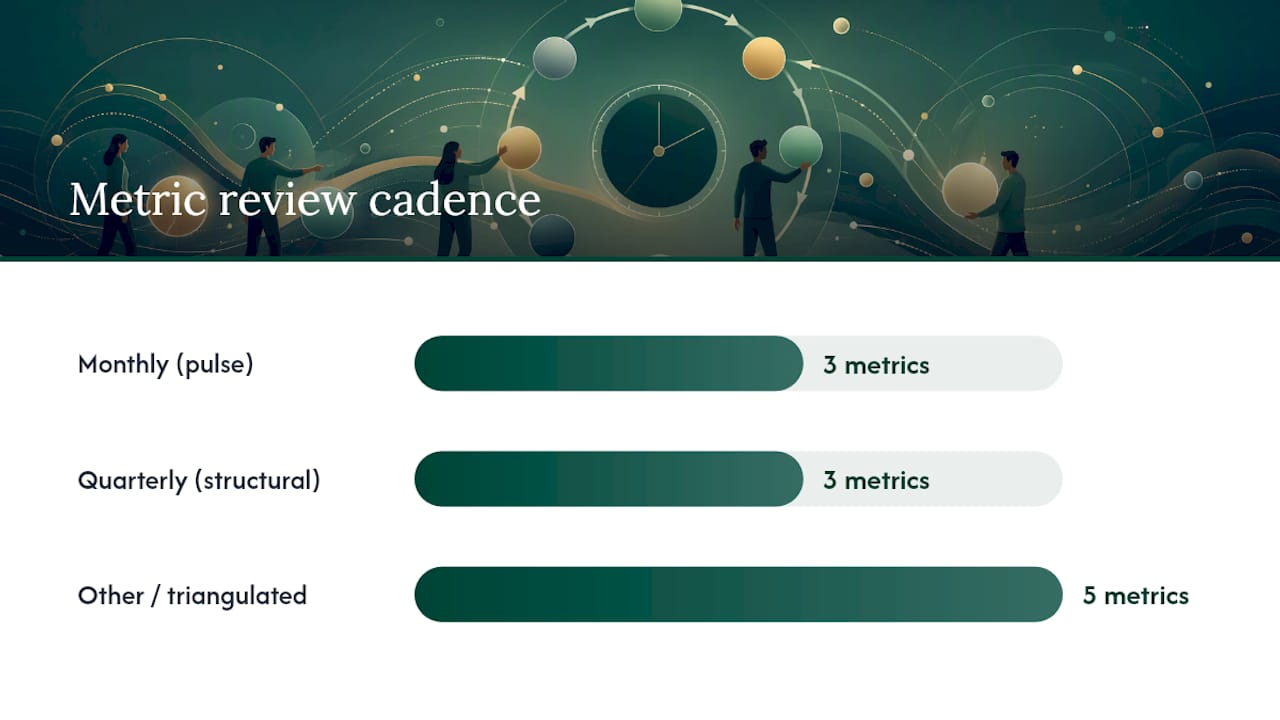
The cadence pattern across all eleven metrics: pulse preference, favorability, and NPS monthly because they move fast and predict revenue changes. Review awareness, associations, and market share quarterly because they’re structurally slower and noisy at high frequency. Triangulating survey reads with behavioral data like search volume and purchase records catches false positives before they reach a board deck.
Tying Brand Metrics to Revenue, CAC, and Retention
A metric that doesn’t connect to a business outcome is trivia. Here are three connections worth building into your reporting.
- Preference and win rate. If brand preference rises in a segment, your sales win rate in that segment should follow within one to two quarters. If it doesn’t, the gap sits in sales execution or pricing, not brand.
- Awareness and customer acquisition cost. Rising unaided awareness should correlate with falling CAC over time, since more people arrive already knowing who you are. Track CAC by channel against your quarterly awareness numbers.
- NPS and retention. A focused set of core metrics tied to revenue and acquisition efficiency works better than a scattered dashboard, and NPS against churn rate is the cleanest pair in that set. Segment by NPS band, not just the average score.
Run this as a scenario, not a spreadsheet exercise. That’s your signal to check the win rate in the segment the campaign targeted. If win rate improved too, the repositioning decision paid off and you scale the campaign. If win rate stayed flat, the brand message landed but sales isn’t converting it, and that’s an entirely different fix.
Pro Tip: Slice CAC and win rate by the same segments you use in your brand surveys. A national average hides regional or demographic swings that brand campaigns often cause.
Building a Measurement Program That Actually Runs
Most brand tracking programs die within a year, not from bad metrics but from bad operations. Here’s the minimum viable setup.
Data mix and cadence:
- Monthly pulse survey covering preference, favorability, and NPS (keep it under five questions to protect response rates)
- Quarterly deep-dive covering unaided and aided awareness, associations, and market share
- Continuous behavioral tracking: branded search volume, website traffic, transaction data, pulled monthly at minimum
Continuous monitoring earns its place here because near-real-time behavioral signals catch early shifts that a quarterly survey would miss until it’s too late to act on cheaply.
Dashboard design by audience:
- Executive view: five numbers, trended over 12 months, tied explicitly to one business KPI each. No raw survey tables.
- Marketing team view: full metric set with segment breakdowns, campaign overlays, and competitor comparisons.
- Product or CX view: NPS, favorability, and loyalty metrics filtered by touchpoint or feature usage.
Governance checklist:
- Assign one owner per metric who’s accountable for reporting and follow-up action, not just data collection.
- Version your survey questions and log every change. A reworded NPS question breaks your trendline even if the intent stayed identical.
- Set minimum sample sizes before trusting a monthly pulse; anything under 100 responses per segment gets flagged as directional, not conclusive.
- Define the action trigger in advance. “If preference drops three points, marketing reviews messaging within two weeks” beats a vague promise to “keep an eye on it.”
Pro Tip: Put governance in writing before your first pulse survey goes out, not after the first confusing result lands in someone’s inbox.
Benchmarking, Standardization, and Where Comparisons Go Wrong
Raw numbers rarely mean anything on their own. A follower count of 50,000 sounds impressive until you learn a competitor with 20,000 followers generates three times the engagement.
That’s why standardized measures like Media Impact Value help compare visibility and influence across platforms, weighting reach, media tier, and placement type instead of treating every mention as equal. Share of Voice and Share of Search work the same way: they give you a relative number against named competitors, which matters more than any absolute figure in isolation.
For benchmarking, pick internal trendlines first (your brand versus itself, quarter over quarter) before chasing external comparisons. External benchmarks only work when you’re comparing against genuinely similar competitors in scale, category, and geography; a startup benchmarking itself against a category leader with 20 years of brand equity is measuring the wrong gap.
Three traps show up constantly:
- Vanity metric worship. Follower growth with no tie to preference or revenue is noise dressed as progress.
- Metric sprawl. Tracking 30 metrics guarantees that none of them get acted on. Actionable, leading, and connected measures beat volume every time.
- Survey fatigue distortion. Long surveys or inconsistent timing quietly corrupt your sample and make quarter-over-quarter comparisons meaningless.
Choosing the Right Metrics for Your Company’s Stage
You don’t need all eleven metrics from day one. Match the set to where the business actually is.
- Early stage: unaided awareness, branded search volume, NPS, preference against your top named competitor, and website conversion rate. Five metrics, all cheap to track, all directly tied to whether anyone knows you exist yet.
- Growth stage: add aided awareness, share of voice, favorability, repeat purchase rate, and CAC by channel. This is where perception and performance data need to start talking to each other.
- Scale stage: layer in market share, brand associations, Media Impact Value, retention by segment, and win rate by region. At this point the dashboard should mirror how the business actually reports revenue.
For every metric you add, set a SMART threshold: specific, measurable, tied to a timeframe, with a named owner and a defined action. “NPS below 40 for two consecutive months triggers a customer success review, owned by the CX lead” is a real threshold. “Watch NPS closely” is not.
Before adding any metric to the core dashboard, ask three questions: Does it change based on a decision we’d actually make? Can we get a reliable read on it every cycle without heroic effort? Does someone on the team own acting on it? If the answer to any of those is no, leave it off.
Applying Brand-Backed Performance to Measurement
Brand-Backed Performance™, one of the frameworks built through Quincy Samycia’s consulting work, treats brand strategy as a business input with a measurable output, not a creative exercise reviewed once a year. The Golden Spiral™ maps how positioning decisions cascade into product, marketing, and sales behavior, which is exactly where most measurement programs lose the thread between a perception shift and a revenue outcome.
A measurement-aligned workshop under this model starts with current metric baselines as input, produces a defined set of core KPIs and thresholds as output, and assigns an owner to each before the room breaks. This discipline gets tested against real sales data, not theory.
Where Brand Measurement Programs Actually Break
The most common failure isn’t a bad metric. It’s too many metrics with no owner and no trigger. I’ve seen teams track twenty numbers monthly and act on none of them.
The fix is smaller and duller than people expect: five core metrics, one owner each, one written action per threshold. Governance beats sophistication, and it needs someone senior enough to enforce it.
— Quincy
Measurement-Aligned Brand Strategy From Quincy Samycia
Most brand tracking fails not from bad metrics but from a brand strategy that was never built to produce measurable output in the first place. Quincy Samycia works differently: brand strategy, positioning, and go-to-market decisions get built around the KPIs your business actually reports on, so the dashboard reflects a strategy designed for it rather than metrics bolted onto a brand plan after the fact.
Engagements typically start with a positioning audit and a measurement baseline, then move into workshops that define your core metric set, thresholds, and owners using frameworks like The Golden Spiral™. You leave with a working dashboard structure, not a slide deck that gets shelved. If your team is tracking brand metrics with no clear tie to revenue or retention, explore the Brand Strategy Frameworks behind this approach and book an initial conversation to see where the gaps sit in your current setup.
Sources
- 10 Brand Metrics To Track Your Performance | SurveyMonkey
- Brand performance: What is brand performance | Launchmetrics
- Brand performance metrics that drive growth | Brandhorse
- Real-time analytics upleveling the modern customer experience | Striim
FAQ
What Are 5 Examples of Metrics to Measure Performance?
Unaided brand awareness, brand preference, Net Promoter Score, share of voice, and repeat purchase rate together cover perception and behavior, and connect directly to revenue and retention outcomes.
What Are the 5 Levels of Brand Recognition?
Common frameworks describe a progression from no awareness, to recognition (aided awareness), to recall (unaided awareness), to top-of-mind awareness, to brand preference or loyalty at the top, though exact labels vary by source.
How Do You Measure Company Performance?
Company performance combines financial metrics like revenue and market share with brand-driven indicators like preference and NPS, since brand metrics tied to acquisition efficiency and revenue explain shifts that financial data alone can’t.
What Are the 5 C’s of Branding?
Definitions vary across sources, but a common version covers clarity, consistency, credibility, competitive advantage, and connection, all of which show up in perception metrics like favorability and brand associations.
How Often Should You Measure Brand Performance?
Pulse high-impact metrics like preference, favorability, and NPS monthly, and run a broader awareness deep-dive quarterly, backed by continuous behavioral tracking like branded search volume.