
Perceptual Map vs. Positioning: What Each Does
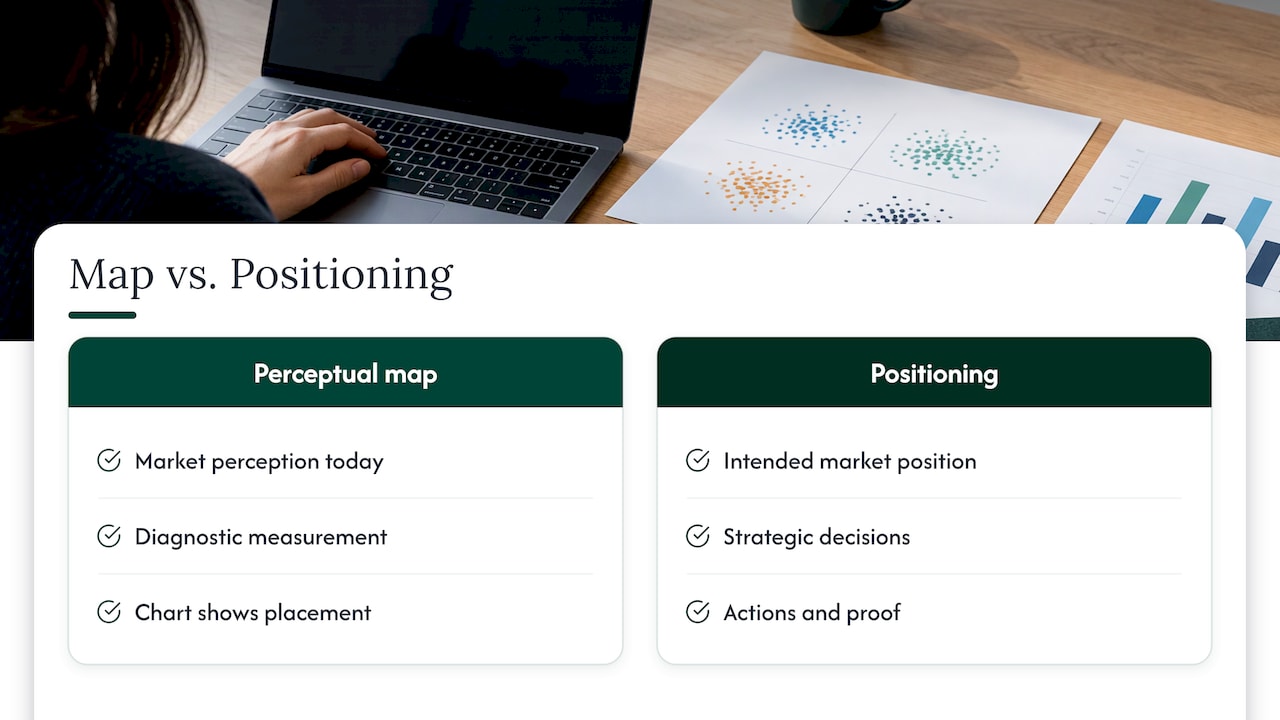
A perceptual map is a picture of how customers see your brand next to its competitors. Positioning is the decision about where you want to stand in their minds, and the work of making that true across product, marketing and sales. The map is a tool you use to find out where you stand today. Positioning is the strategy you build from it.
People also search for “positioning map vs. perceptual map.” Here the answer is more tangled. Some authors treat the two terms as the same chart. Others treat them as two different charts. Both uses are covered below, so you can read any article on the topic without getting lost.
TL;DR
- Positioning is a strategic choice: the place you want your brand to hold in the customer’s mind, and the commitments that back it up.
- A perceptual map is a research output: a two-axis chart of how customers actually perceive you and your competitors.
- Many sources use “positioning map” and “perceptual map” interchangeably. Others reserve “positioning map” for a planning chart based on real features, and “perceptual map” for customer perception.
- The useful sequence is: map perception, compare it to the position you intend, close the gap, then re-map to see if perception moved.
- A map on its own does not tell you what to sell, how to price, or what sales should say. That is the job of positioning.
Table of Contents
- The short answer: a tool versus a strategy
- Perceptual map vs. positioning map: a naming problem
- What positioning covers that a map cannot
- When to use a perceptual map
- How to build a perceptual map that holds up
- A worked example: reading the gap
- Common mistakes when teams mix the two up
- What this means for founders and marketing teams
- Our perspective
- Work with us on positioning
- FAQ
- Sources
The short answer: a tool versus a strategy
Think of a perceptual map as a diagnostic. It answers one question: where does the market place us today? Positioning answers a different one: where should we stand, and what do we have to change to hold that ground?
OpenStax, the open textbook project from Rice University, defines a perceptual map as a diagram showing how the average consumer in your target market perceives your product against competitors. The axes are two determinant attributes, meaning the attributes customers actually use when they decide what to buy. That definition describes a measurement. It says nothing about what you should do with the result.
Positioning, by contrast, is a set of decisions. Who is the offer for? Against which alternatives? On which attribute do we want to win? What proof will make that believable? A positioning statement is the written answer. A positioning strategy is everything required to make customers believe it.
That is why the two are rarely in competition. A founder who says “we need a perceptual map” usually means “we do not know how the market sees us.” A founder who says “we need positioning” usually means “we know how it sees us, and it is not what we want.” The first need leads to the second.
Perceptual map vs. positioning map: a naming problem
The confusion has a simple cause: the sources disagree on vocabulary.
MindTools describes perceptual mapping as also known as positioning mapping. It is a simple graph whose vertical and horizontal axes are labeled with the criteria customers use to decide whether to buy. Most business school and marketing guides follow this convention. If you read one of them, the two names point to the same chart.
Other writers draw a line. LogRocket’s product management blog argues the two are different: a perceptual map shows how customers perceive products in a category, which might be right or wrong, while a positioning map evaluates the actual features of brands and so represents reality.
Shopify’s marketing guide gives a clean example of that split. An Apple Smart Watch and a Timex Expedition watch each sell for $329. On a positioning map based on price, they sit in the same spot. On a perceptual map, Apple’s premium brand image puts the two products in different places.
So which usage should you adopt? Pick one and say so at the start of the meeting. Our suggestion for an internal team:
| Perceptual map | Positioning map (strict sense) | |
|---|---|---|
| What it plots | How customers perceive brands | Where brands actually sit on measurable features |
| Data source | Customer surveys, interviews, reviews | Product specs, prices, internal and market data |
| Can it be wrong? | It records perception, so it is “right” even when customers are mistaken | It reflects reality, so it can disagree with perception |
| Best question it answers | Where does the market place us? | Where do we objectively stand, and where could we move? |
The most valuable moment is when the two charts disagree. If you are objectively cheaper and better built, but customers place you as budget and basic, you have found a positioning problem, not a product problem. Fix the first and you waste money. Fix the second and you change how the market reads what you already have.
Whatever your team calls them, avoid the trap of treating either chart as the strategy. Both are inputs.
What positioning covers that a map cannot
A perceptual map has two axes. A brand has a product, a price, a sales conversation, a customer experience and a story. Reducing all of that to two attributes is the point of the chart, and also its limit.
Harvard Business Review makes this point directly. In “A Better Way to Map Brand Strategy,” Niraj Dawar and Charan K. Bagga explain that traditional perceptual maps place brands on opposing dimensions such as budget versus premium or spicy versus mild. Their business value is limited, the authors argue, because the maps do not link a brand’s position to performance metrics like sales and price. Their alternative, the centrality-distinctiveness map, sizes each brand’s bubble by a metric such as unit sales volume or price, so position and performance appear on one page.
That is the gap positioning has to fill. A map says where you are. Positioning has to connect the place you choose to:
- Product: does what you build deliver the attribute you claim?
- Pricing: does the price signal the same thing the story does? Our piece on how corporate pricing decisions shape brand positioning goes deeper here.
- Sales: does the team say the same thing the website says? See our guide to aligning sales and marketing.
- Measurement: can you tell whether it is working? We list 11 metrics brand teams use for this.
A company can have a flattering map and a weak business. It can also have a modest map and a strong one. What decides which is the link between the position and the numbers, and a map alone does not supply it.
When to use a perceptual map
A map earns its cost in a handful of situations. Quirks, a market research publication, lists five managerial uses: describing which brands compete with which, segmenting consumers, generating product ideas from unoccupied spaces, developing and testing concepts before building, and positioning research, either as an early step in setting a goal or as a way to measure whether the goal was reached.
For a founder or a marketing leader, that translates into four practical moments.
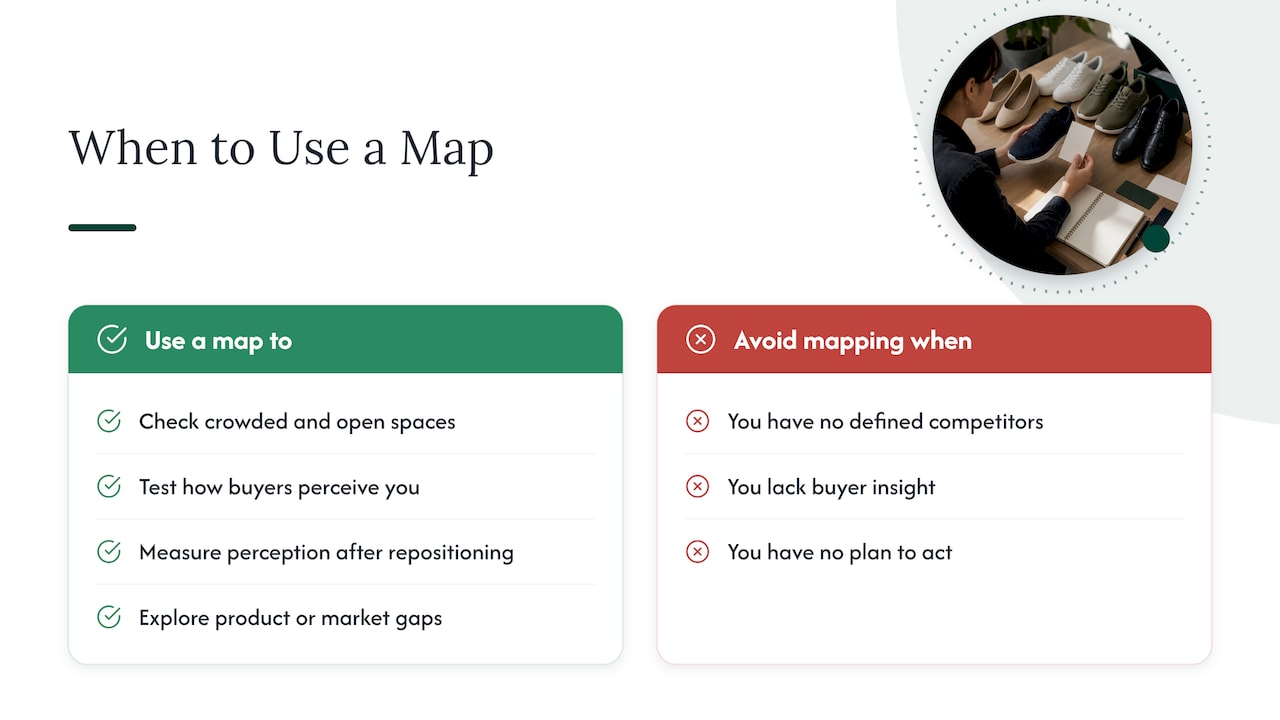
1. Before you set a positioning. You are about to commit budget to a message. A map shows which spaces are crowded and which are open, so you are not choosing a claim every competitor already makes.
2. When sales says the market “does not get us.” A map turns an anecdote into evidence. It shows whether buyers place you where you think they do.
3. After a repositioning, a rebrand or a launch. Shopify’s guide lists tracking changes in consumer perception over time as a core use. Quirks adds that a map can measure whether a chosen positioning goal has been reached. Run it before and after, and you can see whether the work moved perception.
4. When you are looking for a new market or product. Gaps on a map can point to opportunities. A gap is a hypothesis, not a result, and you will want to confirm that customers want something in that spot.
A map is a poor fit when you have no competitors defined, no sense of what buyers care about, or no plan to act on the answer. In those cases the first job is positioning work, and the map comes later.
How to build a perceptual map that holds up
The mechanics are not complicated. The judgment is in the choices.
Step 1: Pick the axes buyers actually use
The axes decide everything. Harvard Business School Online advises choosing attributes that align with the business goals that matter most to customers: price, quality, emotional appeal, or any factor that influences brand perception. It suggests using feedback surveys, online reviews and KPIs to see how your product ranks against competitors before you plot anything.
Where it goes wrong: teams pick the axes they wish mattered. “Innovative versus traditional” is flattering. If buyers decide on implementation speed and support quality, a map built on innovation tells you nothing about why you win or lose deals. Check your lost-deal notes and customer interviews first.
Step 2: Define the competitive set
OpenStax recommends mapping at least 5 to 10 competitors. Include the alternatives buyers actually weigh, which often means a category neighbor, an in-house option or doing nothing, not only the direct rival on your own list. If you want a structured way to choose them, our competitive brand analysis guide walks through it.
Step 3: Collect ratings from the right people
MindTools describes the simplest route: a survey asking customers to score your product and competitors’ products on each chosen dimension with a number between, for example, -5 and +5. You then calculate each product’s average score on each dimension and plot those averages on a grid.
Where it goes wrong: surveying only your own customers. They already chose you, so they rate you higher and know the alternatives less. Include prospects and people who bought elsewhere. OpenStax notes that the map can be built from consumer research, and the quality of that research is the quality of the map.
Step 4: Plot, then read the three signals
Plot the averages. Then look for:
- Clusters. If several brands, including yours, sit together, buyers see them as interchangeable. Your differentiation is not landing.
- Open space. An empty region can be an opportunity, or it can be empty because nobody wants to be there. Test demand before you move in.
- The gap between intended and actual position. This is the most useful result. It is your positioning problem, and it becomes the brief for your messaging.
Step 5: Decide, then re-measure
A map is a snapshot. After you change messaging, product or pricing, run it again with the same method. Without a repeat, you cannot tell whether the repositioning moved perception or whether the market simply drifted.
For a feel of how teams present results, we have collected six positioning map examples with templates.
A worked example: reading the gap
Quirks gives a case that shows how a map feeds a positioning decision. In a cell phone study, the map showed one brand was differentiated but had no image tied to any specific attribute. Reliable service, the feature most important to respondents, was not perceived as owned by any brand. The upper-right corner of the map therefore became the attractive target position, and further research into customers’ deeper motivations, such as peace of mind and staying connected to family, guided the communication strategy.
Notice what each tool did. The map found the open, valuable space. The positioning work decided to claim it and shaped what to say. The brand then had to deliver reliable service, which is a product and operations commitment, not a design one. A map alone would have shown the opportunity and stopped there.
You can run the same reasoning on your own business with simple questions:
- Which attribute matters most to the buyers we want?
- Does any competitor own it in the buyer’s mind?
- If not, can we actually deliver it, and prove it, every time?
- What would have to change in product, price and sales conversation to make that believable?
If question three gets a hesitant answer, the open space is not yours yet.
Common mistakes when teams mix the two up
Treating the map as the strategy. A chart cannot tell you who to serve or what to give up. Positioning requires trade-offs, and a map does not make them for you.
Writing a positioning statement without checking perception. The statement describes where you hope to stand. Without a map or equivalent research, you do not know whether anyone agrees.
Chasing white space. Not every empty region is a market. Confirm that customers want something there before building toward it.
Mapping once. Perception drifts. Competitors change their messaging, and so do you. A single map ages quickly.
Using axes that are really the same thing. “Premium” and “high quality” often move together, which collapses the map onto a diagonal and hides the real choices.
What this means for founders and marketing teams
If you are early and have little data, start with positioning questions and a small round of customer and lost-deal interviews. If you have customers and competitors and cannot explain why deals are won or lost, a map is the next step. If you have both and the two disagree, you are in the most productive position: you know what to fix.
Brand positioning examples are useful at this stage. Our positioning examples for a 60 to 90 minute workshop show how teams turn a map’s findings into a statement the whole company can use.
Our perspective
We rarely see a team that lacks a chart. What they lack is agreement on what the chart means and what they are willing to do about it.
Our view is that brand is a core business strategy, not a marketing tool. A perceptual map is valuable because it makes the market’s view visible. But the position you choose has to run through product, marketing and sales, or it drifts. The map shows the drift. Positioning stops it.
That is why we treat the map as one input to a larger loop. Find out how customers see you. Decide where you want to stand. Align the product, the message and the sales conversation to that position. Then measure whether perception and performance both moved. We built our work around that connection between brand strategy and measurable business results, from an operator’s perspective shaped by building brands and by an exit.
If your map and your numbers tell different stories, start there. The gap between them is usually where the growth is.
Quincy
Work with us on positioning
If you want the map and the strategy handled together, our services cover brand strategy, brand positioning, growth and go-to-market strategy and more. The work connects positioning across product, marketing and sales, with measurable performance as the goal. For teams that want to bring this thinking to a leadership offsite or conference, we also offer speaking.
Bring your current positioning statement and your most frequent lost-deal reasons. Those two documents are usually enough to show whether you have a perception problem, a strategy problem, or both. You can explore our brand strategy frameworks beforehand to see how we structure the work.
FAQ
Is a perceptual map the same as a positioning map?
Often, yes. Many guides, including MindTools, treat the names as synonyms. Some writers separate them: a perceptual map shows customer perception, and a positioning map shows actual features. Agree on one definition inside your team before you start.
What is the difference between positioning and a positioning map?
Positioning is the strategic choice about where your brand should stand in the customer’s mind, backed by product, price and sales behavior. A positioning map is a chart that helps you see the competitive field. The chart informs the decision. It does not replace it.
How many competitors and respondents do I need?
OpenStax recommends mapping at least 5 to 10 competitors. For respondents, aim for a representative sample of the buyers you want to win, not only existing customers. More responses make the averages steadier, so a larger sample is the safer basis for a budget decision.
How often should I redo a perceptual map?
Run it before a repositioning and again after, using the same method, so the two are comparable. Between campaigns, repeat it on a regular schedule, for example yearly, so you can see drift. Re-run sooner after a major launch or competitor move.
Can a perceptual map show me a new market?
It can point to one. An empty region may signal an unmet need, and OpenStax lists gaps as a possible signal for new offerings. Treat the gap as a hypothesis and confirm that buyers want something there and that you can deliver it.
Sources
- 5.6 Product Positioning, Principles of Marketing (OpenStax)
- Perceptual Mapping (MindTools)
- What is a perceptual map and how to build one (LogRocket)
- How To Use Perceptual Mapping for Better Marketing (Shopify)
- A Better Way to Map Brand Strategy (Harvard Business Review)
- How to Use Perceptual Mapping to Assess Your Competition (Harvard Business School Online)
- Laddering, mapping lead the way to better positioning (Quirk’s)